library(shiny)
library(shinydashboard)
library(qgraph)
library(igraph)
library(shinycssloaders)
library(knitr)
# UI ----
ui <- dashboardPage(
title = "Shiny Networks",
skin = "green",
dashboardHeader(title = "Untangling the Growing Network Web",titleWidth = 400),
# Menu options----
dashboardSidebar(
sidebarMenu(
menuItem("Home", tabName = "overview", icon = icon("home")),
menuItem("Info", tabName = "info", icon = icon("info")),
menuItem("Simulate", tabName = "simulation", icon = icon("cogs"),
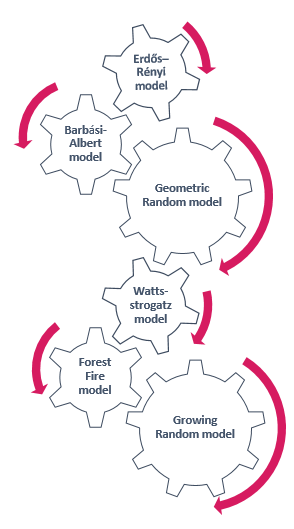
menuSubItem("Erdos-Renyi model", tabName = "model3"),
menuSubItem("Watts-Strogatz model", tabName = "model2"),
menuSubItem("Barabasi-Albert model", tabName = "model1"),
menuSubItem("Geometric Random model", tabName = "model5"),
menuSubItem("Growing Random model", tabName = "model6"),
menuSubItem("Forest Fire model", tabName = "model4")),
menuItem("Upload Data", tabName = "upload", icon = icon("upload")),
menuItem("Quiz",tabName = "quiz", icon = icon("question-circle")),
menuItem("Developers",tabName = "developers", icon = icon("users"))
)
),
# Body
dashboardBody(
includeScript("../../../Matomo-tquant.js"),
tabItems(
# Homepage----
tabItem(tabName = "overview",
column(12, align = "center", titlePanel(HTML('<font size="10" face = "Impact">An Illustrative Collection of Network Models</font>'))),
br(),
br(),
br(),
br(),
fluidRow(
column( 4, align = "bottom",
box(
title = "Erdos-Renyi model", status = "success", solidHeader = TRUE,
collapsible = FALSE,width = 10,
img(src = 'model3.gif', height = 250, width = 350, align = "center")
)),
column( 4, align = "bottom",
box(
title = "Watts-Strogatz model", status = "success", solidHeader = TRUE,
collapsible = FALSE,width = 10,
img(src = 'model2.gif', height = 250, width = 350, align = "center")
)),
column( 4, align = "bottom",
box(
title = "Barabasi-Albert model", status = "success", solidHeader = TRUE,
collapsible = FALSE,width = 10,
img(src = 'model1.gif', height = 250, width = 350, align = "center")
))),
br(),
fluidRow(
column( 4, align = "bottom",
box(
title = "Geometric Random model", status = "success", solidHeader = TRUE,
collapsible = FALSE,width = 10,
img(src = 'model5.gif', height = 250, width = 350, align = "center")
)),
column( 4, align = "bottom",
box(
title = "Growing Random model", status = "success", solidHeader = TRUE,
collapsible = FALSE,width = 10,
img(src = 'model6.gif', height = 250, width = 350, align = "center")
)),
column( 4, align = "bottom",
box(
title = "Forest Fire model", status = "success", solidHeader = TRUE,
collapsible = FALSE,width = 10,
img(src = 'model4.gif', height = 250, width = 350, align = "center")
))
)
),
# Barabasi-Albert sampling----
tabItem(tabName = "model1",
fluidPage(
# Style----
# Set the progress bar colors
tags$head(tags$style(".progress-bar{background-color:#00AC59;}")),
# Center box headers
tags$head(tags$style(HTML("
div.box-header {
text-align: center;
}
"))),
# Favicon in the browser
tags$head(tags$link(rel="shortcut icon", href="favicon.png")),
# Style the sliders
tags$style(HTML(".js-irs-0 .irs-single, .js-irs-0 .irs-bar-edge, .js-irs-0 .irs-bar {background: #00AC59}")),
tags$style(HTML(".js-irs-1 .irs-single, .js-irs-1 .irs-bar-edge, .js-irs-1 .irs-bar {background: #00AC59}")),
tags$style(HTML(".js-irs-2 .irs-single, .js-irs-2 .irs-bar-edge, .js-irs-2 .irs-bar {background: #00AC59}")),
tags$style(HTML(".js-irs-3 .irs-single, .js-irs-3 .irs-bar-edge, .js-irs-3 .irs-bar {background: #00AC59}")),
tags$style(HTML(".js-irs-4 .irs-single, .js-irs-4 .irs-bar-edge, .js-irs-4 .irs-bar {background: #00AC59}")),
tags$style(HTML(".js-irs-5 .irs-single, .js-irs-5 .irs-bar-edge, .js-irs-5 .irs-bar {background: #00AC59}")),
tags$style(HTML(".js-irs-6 .irs-single, .js-irs-6 .irs-bar-edge, .js-irs-6 .irs-bar {background: #00AC59}")),
tags$style(HTML(".js-irs-7 .irs-single, .js-irs-7 .irs-bar-edge, .js-irs-7 .irs-bar {background: #00AC59}")),
tags$style(HTML(".js-irs-8 .irs-single, .js-irs-8 .irs-bar-edge, .js-irs-8 .irs-bar {background: #00AC59}")),
tags$style(HTML(".js-irs-9 .irs-single, .js-irs-9 .irs-bar-edge, .js-irs-9 .irs-bar {background: #00AC59}")),
tags$style(HTML(".js-irs-10 .irs-single, .js-irs-10 .irs-bar-edge, .js-irs-10 .irs-bar {background: #00AC59}")),
tags$style(HTML(".js-irs-11 .irs-single, .js-irs-11 .irs-bar-edge, .js-irs-11 .irs-bar {background: #00AC59}")),
tags$style(HTML(".js-irs-12 .irs-single, .js-irs-12 .irs-bar-edge, .js-irs-12 .irs-bar {background: #00AC59}")),
tags$style(HTML(".js-irs-13 .irs-single, .js-irs-13 .irs-bar-edge, .js-irs-13 .irs-bar {background: #00AC59}")),
tags$style(HTML(".js-irs-14 .irs-single, .js-irs-14 .irs-bar-edge, .js-irs-14 .irs-bar {background: #00AC59}")),
fluidRow(
sidebarPanel(h1("Barabasi-Albert model"),
p("The Barabasi-Albert model is an algorithm for
generating random scale-free networks using a preferential
attachment mechanism. It incorporates two important general concepts:
growth and preferential attachment. Growth means that the number of nodes in the
network increases over time. Preferential attachment means that the more connected a node is, the more
likely it is to receive new links."),
sliderInput(
"n",
"Number of vertices",
min = 10, max = 200, step = 1, value = 100, width = 400
),
sliderInput(
"power",
"Power",
min = 0, max = 10, step = .25, value = 1, width = 400
),
sliderInput(
"m",
"Edges added per time step",
min = 1, max = 10, step = 1, value = 1, width = 400
),
checkboxInput(
"directed1",
"Directed graph"
),
actionButton('sample1', 'Resample',
style="color: white; background-color: #00AA59; border-color: black",
icon = icon("arrow-up"))
),
mainPanel(
withSpinner(plotOutput("BAplot"),type = 6, color = "green")
)
)
)
),
# Watts-Strogatz sampling----
tabItem(tabName = "model2",
fluidPage(
sidebarPanel(
h1("Watts-Strogatz model"),
p("The Watts-Strogatz model is a random graph generation model that produces graphs with small-world properties,
including short average path lengths and high clustering."),
sliderInput(
"size", "Size",
min = 10, max = 200, step = 1, value = 100),
sliderInput(
"neighbourhood", "Neighborhood",
min = 0, max = 10, step = 1, value = 5),
sliderInput(
"probability",
"Rewiring probability",
min = 0, max = 1, step = 0.1, value = 0.05),
actionButton(inputId = 'sample2', 'Resample',
style="color: white; background-color: #00AA59; border-color: black",
icon = icon("arrow-up"))
),
mainPanel(
withSpinner(plotOutput("WSplot"), type = 6, color = "green")
)
)),
# Erdos-Renyi sampling----
tabItem(tabName = "model3",
fluidPage(
sidebarPanel(
h1("Erdos-Renyi model"),
p("The Erdos-Renyi model is an algorithm for generating random graphs. In this model
all graphs on a fixed vertex set with a fixed number of edges are equally likely to occur. Because of
this property, the Erdos-Renyi model produces graphs with few clusters."),
sliderInput(
"vertices", "Number of vertices",
min = 10, max = 200, step = 1, value = 150),
sliderInput(
"edges", "Number of edges",
min = 400, max = 800, step = 1, value = 400),
checkboxInput(
"directed3",
"Directed graph"
),
actionButton(inputId = 'sample3', 'Resample',
style="color: white; background-color: #00AA59; border-color: black",
icon = icon("arrow-up"))
),
mainPanel(
withSpinner(plotOutput("ERplot"), type = 6, color = "green")
)
)
),
# Forest Fire sampling----
tabItem(tabName = "model4",
fluidPage(
sidebarPanel(
h1("Forest Fire model"),
p("The Forest Fire model is an algorithm for generating scale-free graphs. The graphs generated
by this model display a high degree of self-organization."),
sliderInput(
"nodes", "Number of nodes",
min = 10, max = 200, step = 1, value = 100),
sliderInput(
"probfor", "Burning forward probability",
min = 0, max = 1, step = 0.01, value = .5),
sliderInput(
"probback", "Burning backwards probability",
min = 0, max = 1, step = 0.01, value = .5),
checkboxInput(
"directed4",
"Directed graph"
),
actionButton('sample4', 'Resample',
style="color: white; background-color: #00AA59; border-color: black",
icon = icon("arrow-up"))
),
mainPanel(
withSpinner(plotOutput("FFplot"), type = 6, color = "green")
)
)
),
# Geometric random sampling----
tabItem(tabName = "model5",
fluidPage(
sidebarPanel(
h1("Geometric Random model"),
p("The random geometric graph model represents the simplest network possible, namely one constructed by
randomly placing nodes in a space and connecting two nodes only if their distance is in a given range. Because of
this method, random graphs have the possibility to create clusters."),
sliderInput(
"node", "Number of nodes",
min = 0, max = 200, step = 1, value = 100),
sliderInput(
"radius", "size of radius",
min = 0.2, max = 1, step = 0.01, value = 0.2),
checkboxInput(
"torus", "Use torus"),
actionButton('sample5', 'Resample',
style="color: white; background-color: #00AA59; border-color: black",
icon = icon("arrow-up"))
),
mainPanel(
withSpinner(plotOutput("RGGplot"), type = 6, color = "green")
)
)
),
# Growing random sampling----
tabItem(tabName = "model6",
fluidPage(
sidebarPanel(
h1("Growing Random model"),
p("The Growing Random model is an algorithm for generating random graphs.
It is a discrete time step model, meaning that in each time step a new vertex is added to the graph
and several new edges are created."),
sliderInput(
"vertices", "Number of vertices",
min = 10, max = 200, step = 1, value = 100),
sliderInput(
"edges", "Edges added in each time step",
min = 1, max = 10, step = 1, value = 1),
checkboxInput(
"directed6",
"Directed graph"
),
checkboxInput(
"citation",
"Citation graph: in each time step the added edges are originating from the new vertex"
),
actionButton('sample6', 'Resample',
style="color: white; background-color: #00AA59; border-color: black",
icon = icon("arrow-up"))
),
mainPanel(
withSpinner(plotOutput("SGplot"),type = 6, color = "green")
)
)
),
# Upload file----
tabItem(tabName = "upload",
fluidPage(
sidebarPanel(
h1("Upload Adjacency matrix"),
p("In this tab you can upload an adjacency matrix in a .txt file. The program will
create a graph corresponding to the uploaded matrix. It will then move on to compute
the log likelihood for the Barabasi-Albert, Erdos-Renyi, Geometric Random and Growing Random models
and show you which model was most likely to have generated your uploaded graph structure."),
fileInput("data", label = "", width = "400px",
buttonLabel = "Browse",
placeholder = "No file selected"),
actionButton("upl", label = "Upload",
style="color: white; background-color: #00AA59; border-color: black",
icon = icon("upload"))
),
mainPanel(
plotOutput("graph"),
tableOutput("result")
)
)
),
# Info ----
tabItem(tabName = "info",
column(12, align = "center",
titlePanel(HTML('<font size="10" face = "Impact">Background Information</font>'))),
fluidPage(
column( width = 5,
fluidRow(
box(title = "RANDOM NETWORKS",
"A random graph is obtained by randomly sampling from a collection of graphs.
Early random graphs, in contrast to free-scale graphs, start with a vertex (representing isolated
nodes) and select, at random, edges not yet chosen.",
width = NULL, status = "warning", solidHeader = TRUE)
),
fluidRow(
box(title = "Erdos-Renyi Model",
"- Introduced in 1959 by mathematicians Paul Erdos and Alfred Renyi",
br(),
"- It is a random graph",
br(),
"- A fixed vertex with a fixed number of edges",
width = NULL, status = "primary", solidHeader = TRUE)
),
fluidRow(
box(title = "Wattz Stogatz Model",
"- Random Graph generation model",
br(),
"- Builds on Erdos-Renyi Model - small world",
br(),
"- Short average path length, high clustering",
br(),
"- Does not account for formation of hubs",
width = NULL, status = "primary", solidHeader = TRUE)
),
fluidRow(
box(title = "Random Geometric Graph (RGG)",
"- Mathimatically this is the simplest spatial network",
br(),
"- It is an undirected graph (directionality of the nodes is unimportant)",
br(),
"- Places n nodes randomly in some metric space",
width = NULL, status = "primary", solidHeader = TRUE)
),
fluidRow(
box(title = "Growing Random Model",
"- Each vertex mapped is assigned random coordinates in a geometric space of
arbitrary dimensionality",
br(),
"- It only includes edges between adjacent points",
width = NULL, status = "primary", solidHeader = TRUE)
)
),
column(width = 4,
img(src='overview.png', align = "centre", height = 690,
width = 390)
),
column(width = 3,
fluidRow(
box(title = "SCALE-FREE NETWORKS",
"Scale-free networks, also called power-law networks or free-scale
networks, are those whose degree distribution is based on a power-law.
In other words, the number of edges a node has is linked to the number
of edges nodes which this node is connected to have. Thus, a new node is likely
to be connected to an already well connected node.",
width = NULL, status = "warning", solidHeader = TRUE)
),
fluidRow(
box(title = "Barabasi Albert Model",
"- Generates random, free scale models",
br(),
"- Preferential Attachment - popular nodes to popular nodes",
br(),
"- Based on a power law (free scale) distribution",
width = NULL, status = "primary", solidHeader = TRUE)
),
fluidRow(
box(title = "Forest Fire Model",
"- Dynamic system based on a high degree of self- organisation",
br(),
"- May arise from a combination of the following examplary components:",
br(),
" - Rich-get-richer process - leads to heavy-tailed in-degrees",
br(),
" - Community Guided Attachment (difficulty of forming an attachment
between communities increases with size of community) ",
width = NULL, status = "primary", solidHeader = TRUE)
)
)
)
),
# Quiz----
tabItem(tabName = "quiz",
fluidPage(
fluidRow(
column(width = 4,
# question1 ----
box(title = "Question 1",
radioButtons(
"graph_id",
"What type of graph is displayed on the right",
c("Erdos-Renyi" = "erdos",
"Barabasi-Albert model" = "barab",
"Forest Fire model" = "forest",
"Watts-Strogatz" = "watts"
)
), actionButton("submit1", "Check"),
status = "primary", width = NULL, solidHeader = TRUE)
),
column(width = 4,
box(img(src='quizPlot1.jpeg', align = "center", height = 207,
width = 260), status = "primary",
width = NULL, background = "light-blue")),
column(width = 4,
# question2 ----
box(title = "Question 2",
radioButtons(
"usage",
"What do modern random graphs allow us to do?",
c("Give us exact answers to complex questions" = "1",
"Find out about statistical properties of large graphs" = "2",
"Show the interconnectedness of all things" = "3")
), actionButton("submit2", "Check"),
status = "primary", height = 230, width = 12, solidHeader = TRUE))),
fluidRow(
column(width = 4,
# question3a ----
box(title = "Question 3a",
radioButtons(
"barabasi",
"What might one use the Barabasi-Albert model to explain?",
c("World Wide Web" = "1",
"Social Networks" = "2",
"Citation Networks" = "3")
), actionButton("submit3a", "Check"),
status = "primary", height = 265, width = NULL, solidHeader = TRUE)
),
column(width = 4,
# question3b ----
box(title = "Question 3b",
radioButtons(
"barabasi2",
"So, what is true about the Barabasi-Albert model?",
c("It has a power-law degree distribution" = "1",
"It does not include preferential attachment" = "2",
"The number of its nodes decrease over time" = "3",
"The algorithm creates all included nodes simultaneously" = "4")
),
actionButton("submit3b", "Check"),
status = "primary", height = 265, width = NULL, solidHeader = TRUE)
),
column(width = 4,
# question4 ----
box(title = "Question 4",
radioButtons(
"geom",
"What might 'degree assortativity' observed in random geometric graphs
refer to?",
c("'Popular' nodes are particularly likely to be linked to other popular nodes" = "1",
"The number of edges is dependent on the number of nodes present" = "2",
"Only nodes with the same number of links are connected" = "3")
),
actionButton("submit4", "Check"),
status = "primary", width = NULL, solidHeader = TRUE)
)),
fluidRow(
column(width = 4,
box(img(src='forest_fire_model.gif', align = "center", height = 225,
width = 240), status = "primary",
width = NULL, background = "light-blue")),
column(width = 4,
# question5 ----
box(title = "Question 5",
radioButtons(
"fire",
"What model might the Gif on the left illustrate?",
c("Erdos-Renyi" = "erdos",
"Random Graph model" = "random",
"Forest Fire model" = "forest",
"Watts-Strogatz" = "watts")
),
actionButton("submit5", "Check"),
status = "primary", height = 249, width = NULL, solidHeader = TRUE
)),
column(width = 4,
# question6 ----
box(title = "Question 6",
numericInput(
"final",
"Now for the big finale: On a scale from 1 to 10, how would you rate this App?",
value = 0, min = 0, max = 10, step = 1
),
actionButton("submit6", "Submit"),
status = "primary", height = 249, width = NULL, solidHeader = TRUE
))
)
)
),
# developersPage ----
tabItem(tabName = "developers",
column(12, align = "center", titlePanel(HTML('<font size="10" face = "Impact">The brains behind the project</font>'))),
br(),
br(),
fluidPage(
fluidRow(
column(width = 2,
img(src='ina.jpg', align = "left", height = 180, width = 150)),
column(width = 6,
box(title = "Ina",
"University of Tubingen",
br(), br(),
"One sentence about myself:",
br(),
"'I am a highly motivated person trapped in a lazy body'",
status = "success", width = NULL, solidHeader = TRUE, height = 180))
),
fluidRow(
column(width = 2,
img(src='koen.jpg', align = "left", height = 180, width = 150)),
column(width = 6,
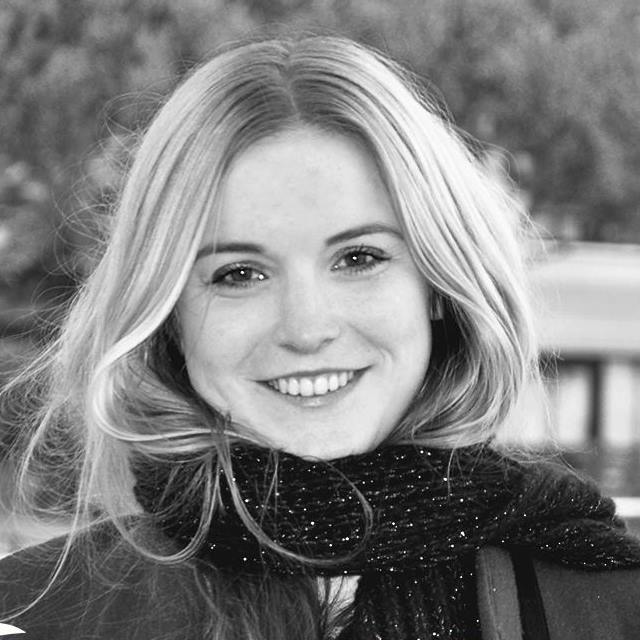
box(title = "Koen",
"University of Amsterdam",
br(), br(),
"One sentence about myself:",
br(),
"'I love my dog'",
status = "success", width = NULL, solidHeader = TRUE, height = 180))
),
fluidRow(
column(width = 2,
img(src='laura.jpg', align = "left", height = 180, width = 150)),
column(width = 6,
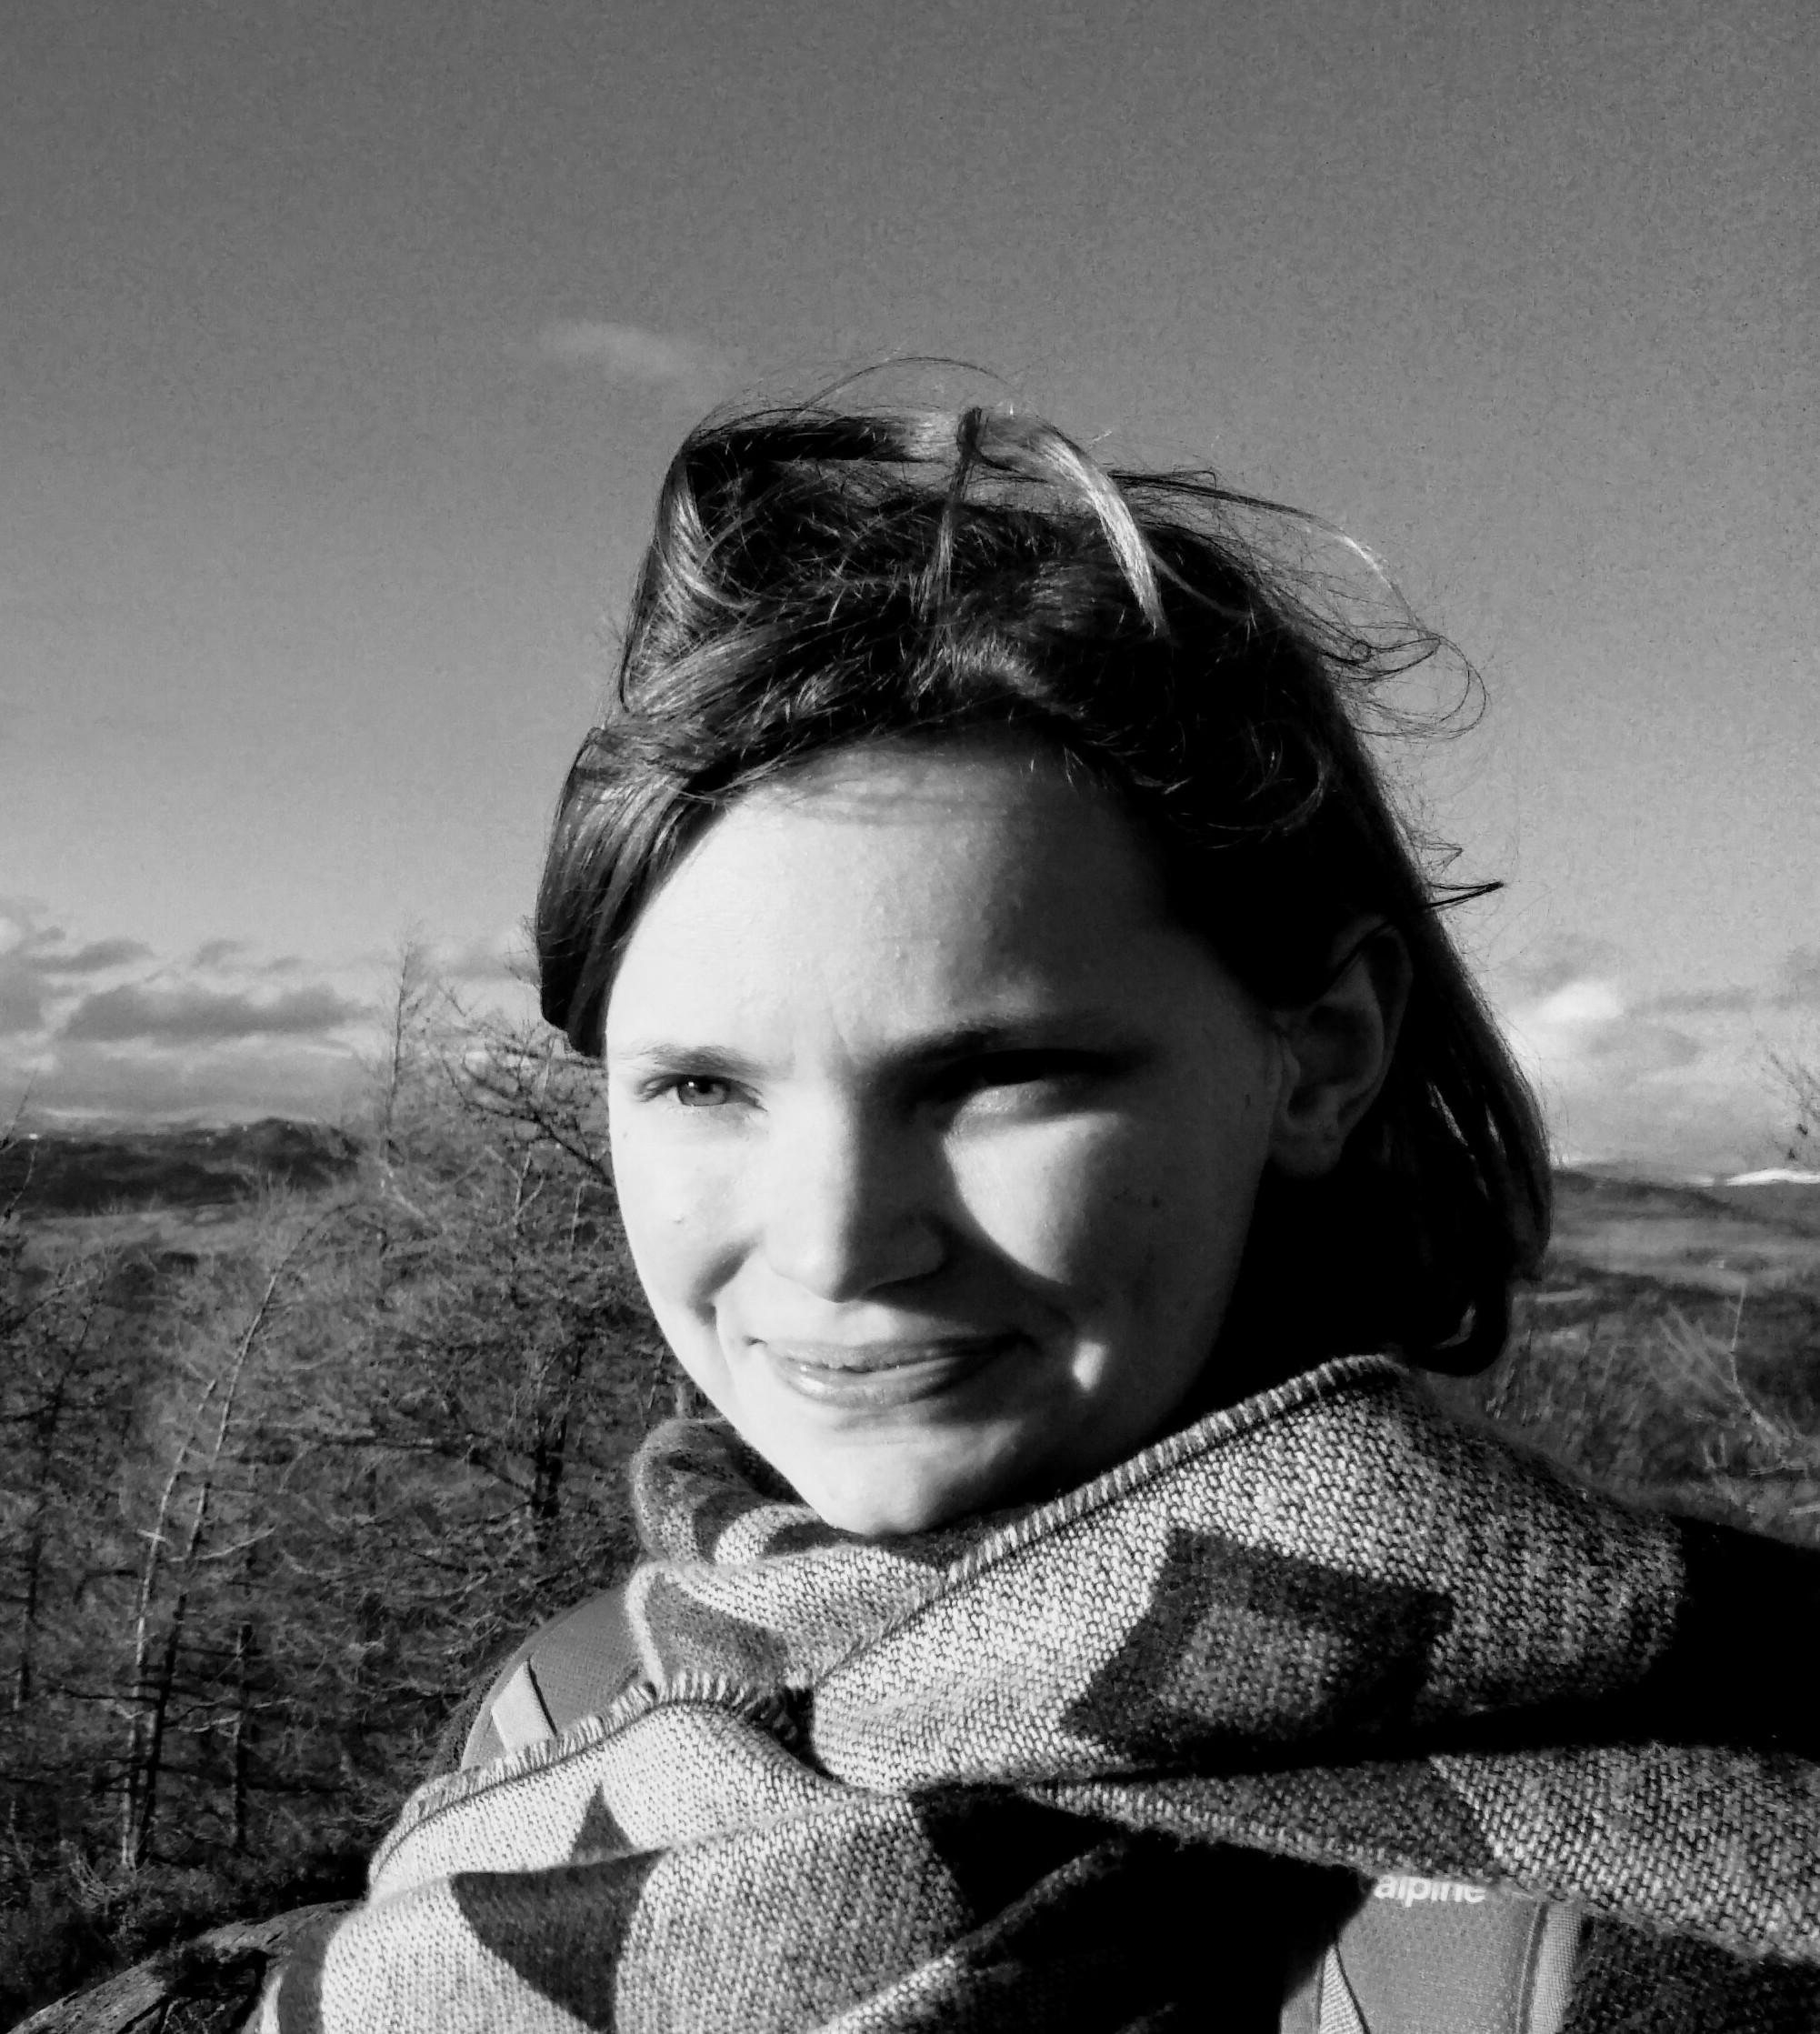
box(title = "Laura",
"University of Glasgow",
br(), br(),
"One sentence about myself:",
br(),
"'I eat porridge every day'",
status = "success", width = NULL, solidHeader = TRUE, height = 180))
),
fluidRow(
column(width = 2,
img(src='margo.jpg', align = "left", height = 180, width = 150)),
column(width = 6,
box(title = "Margo",
"University of Leuven",
br(), br(),
"One sentence about myself:",
br(),
"'Sushi makes me happy'",
status = "success", width = NULL, solidHeader = TRUE, height = 180))
),
fluidRow(
column(width = 2,
img(src='sheeling.png', align = "left", height = 180, width = 150)),
column(width = 6,
box(title = "Sheeling",
"University of Leuven",
br(), br(),
"One sentence about myself:",
br(),
"'HAHAHAHAHAHAHAHAHAHAHAHAHA{!}'",
status = "success", width = NULL, solidHeader = TRUE, height = 180))
),
fluidRow(
column(width = 4),
column(width = 4,
img(src='allOfus.jpg', align = "center", height = 250, width = 300)
))
)
)
)
)
)
server <- function(input, output) {
## Helper function----
growing <- function(db, delta){
delta <- seq(0.05,.95,by = .005)
likelihood <- NULL
output <- list()
for(j in 1:length(delta)){
temp <- NULL
for(i in 1:length(db)){
temp[i] <- ((2*delta[j])^db[i])/((1+2*delta[j])^(db[i]+1))
}
likelihood[j] <- sum(temp)
output[[j]] <- temp
}
likelihood <- log(likelihood)
for(l in 1:length(likelihood)){
if(likelihood[l] == max(likelihood)){
final <- output[[l]]
}
}
return(final)
}
## Initialize Barabasi-Albert ----
g1 <- igraph::sample_pa(n = 150, power = 1, m = 1, directed = FALSE)
p1 <- try({clusters1 <- igraph::spinglass.community(g1)$membership})
if(class(p1) == "try-error"){
clusters1 <- "black"
}
g1 <- igraph::get.adjacency(g1)
output$BAplot <- renderPlot({qgraph::qgraph(g1, color = clusters1, edge.color = "darkgrey", edge.width = .5, vsize = 5,
border.color = "black", shape = "circle",label.cex = 1.5, label.color = "white",
bg = "gray94", borders = FALSE)},
width = 950,
height = 700)
## Resample when button is pressed ##
observeEvent(input$sample1, {
withProgress(message = 'Generating graph', value = 0, {
g <- igraph::sample_pa(n = input$n, power = input$power, m = input$m, directed = input$directed1)
incProgress(1/3)
p1 <- try({clusters1 <- igraph::spinglass.community(g)$membership})
if(class(p1) == "try-error"){
cluster1 <- "black"
}
incProgress(1/3)
g <- igraph::get.adjacency(g)
incProgress(1/3)
output$BAplot <- renderPlot({qgraph::qgraph(g, color = clusters1, edge.color = "darkgrey", edge.width = .5, vsize = 5,
border.color = "black", shape = "circle",label.cex = 1.5, label.color = "white",
bg = "gray94", borders = FALSE)},
width = 950,
height = 700)
})
})
## Initialize Watts-Strogatz ----
g2 <- igraph::sample_smallworld(dim = 1, size = 100, nei = 5, p = .1)
p2 <- try({clusters2 <- igraph::spinglass.community(g2)$membership})
if(class(p2) == "try-error"){
cluster2 <- "black"
}
g2 <- igraph::get.adjacency(g2)
output$WSplot <- renderPlot({qgraph::qgraph(g2, color = clusters2, edge.color = "darkgrey", edge.width = .5, vsize = 5,
border.color = "black", shape = "circle",label.cex = 1.5, label.color = "white", repulsion = 2,
bg = "gray94", borders = FALSE)},
width = 950,
height = 700)
## Resample when button is pressed ##
observeEvent(input$sample2,
{
withProgress(message = 'Generating graph', value = 0, {
g <- igraph::sample_smallworld(dim = 1, size = input$size, nei = input$neighbourhood, p = input$probability)
incProgress(1/3)
p2 <- try({clusters2 <- igraph::spinglass.community(g)$membership})
if(class(p2) == "try-error"){
cluster2 <- "black"
}
incProgress(1/3)
g <- igraph::get.adjacency(g)
incProgress(1/3)
output$WSplot <- renderPlot({qgraph::qgraph(g, color = clusters2, edge.color = "darkgrey", edge.width = .5, vsize = 5,
border.color = "black", shape = "circle",label.cex = 1.5, label.color = "white", repulsion = 2,
bg = "gray94", borders = FALSE)},
width = 950,
height = 700)
})
})
## Initialize Erdos-Renyi ----
g3 <- igraph::erdos.renyi.game(n = 150, p.or.m = 400, type = "gnm", directed = FALSE)
# Some error handling
p3 <- try({clusters3 <- igraph::spinglass.community(g3)$membership})
if(class(p3) == "try-error"){
clusters3 <- "black"
}
g3 <- igraph::get.adjacency(g3)
output$ERplot <- renderPlot({qgraph::qgraph(g3, color = clusters3, edge.color = "darkgrey", edge.width = .5, vsize = 5,
border.color = "black", shape = "circle", label.cex = 1.5, label.color = "white",
bg = "gray94", borders = FALSE)},
width = 950,
height = 700)
## Resample when button is pressed ##
observeEvent(input$sample3,
{
withProgress(message = 'Generating graph', value = 0, {
g3 <- igraph::erdos.renyi.game(n = input$vertices, p.or.m = input$edges, type = "gnm", directed = input$directed3)
incProgress(1/3)
p3 <- try({clusters3 <- igraph::spinglass.community(g3)$membership})
if(class(p3) == "try-error"){
clusters3 <- "black"
}
incProgress(1/3)
g3 <- igraph::get.adjacency(g3)
incProgress(1/3)
output$ERplot <- renderPlot({qgraph::qgraph(g3, color = clusters3, edge.color = "darkgrey", edge.width = .5, vsize = 5,
border.color = "black", shape = "circle", label.cex = 1.5, label.color = "white",
bg = "gray94", borders = FALSE)},
width = 950,
height = 700)
})
})
## Initialize Forest Fire ----
g4 <- igraph::sample_forestfire(nodes = 100, fw.prob=0.5, bw.factor=0.5,directed = FALSE)
p4 <- try({clusters4 <- spinglass.community(g4)$membership})
if(class(p4) == "try-error"){
clusters4 <- "black"
}
g4 <- igraph::get.adjacency(g4)
output$FFplot <- renderPlot({qgraph::qgraph(g4, color = clusters4, edge.color = "darkgrey", edge.width = .5, vsize = 5,
border.color = "black", shape = "circle", label.cex = 1.5, label.color = "white",
bg = "gray94", borders = FALSE)},
width = 950,
height = 700
)
## Resample when button is pressed ##
observeEvent(input$sample4,
{
withProgress(message = 'Generating graph', value = 0, {
g4 <- igraph::sample_forestfire(nodes = input$nodes, fw.prob=input$probfor,bw.factor=input$probback,
directed = input$directed4)
incProgress(1/3)
p4 <- try({clusters4 <- spinglass.community(g4)$membership})
if(class(p4) == "try-error"){
clusters4 <- "black"
}
incProgress(1/3)
g4 <- igraph::get.adjacency(g4)
incProgress(1/3)
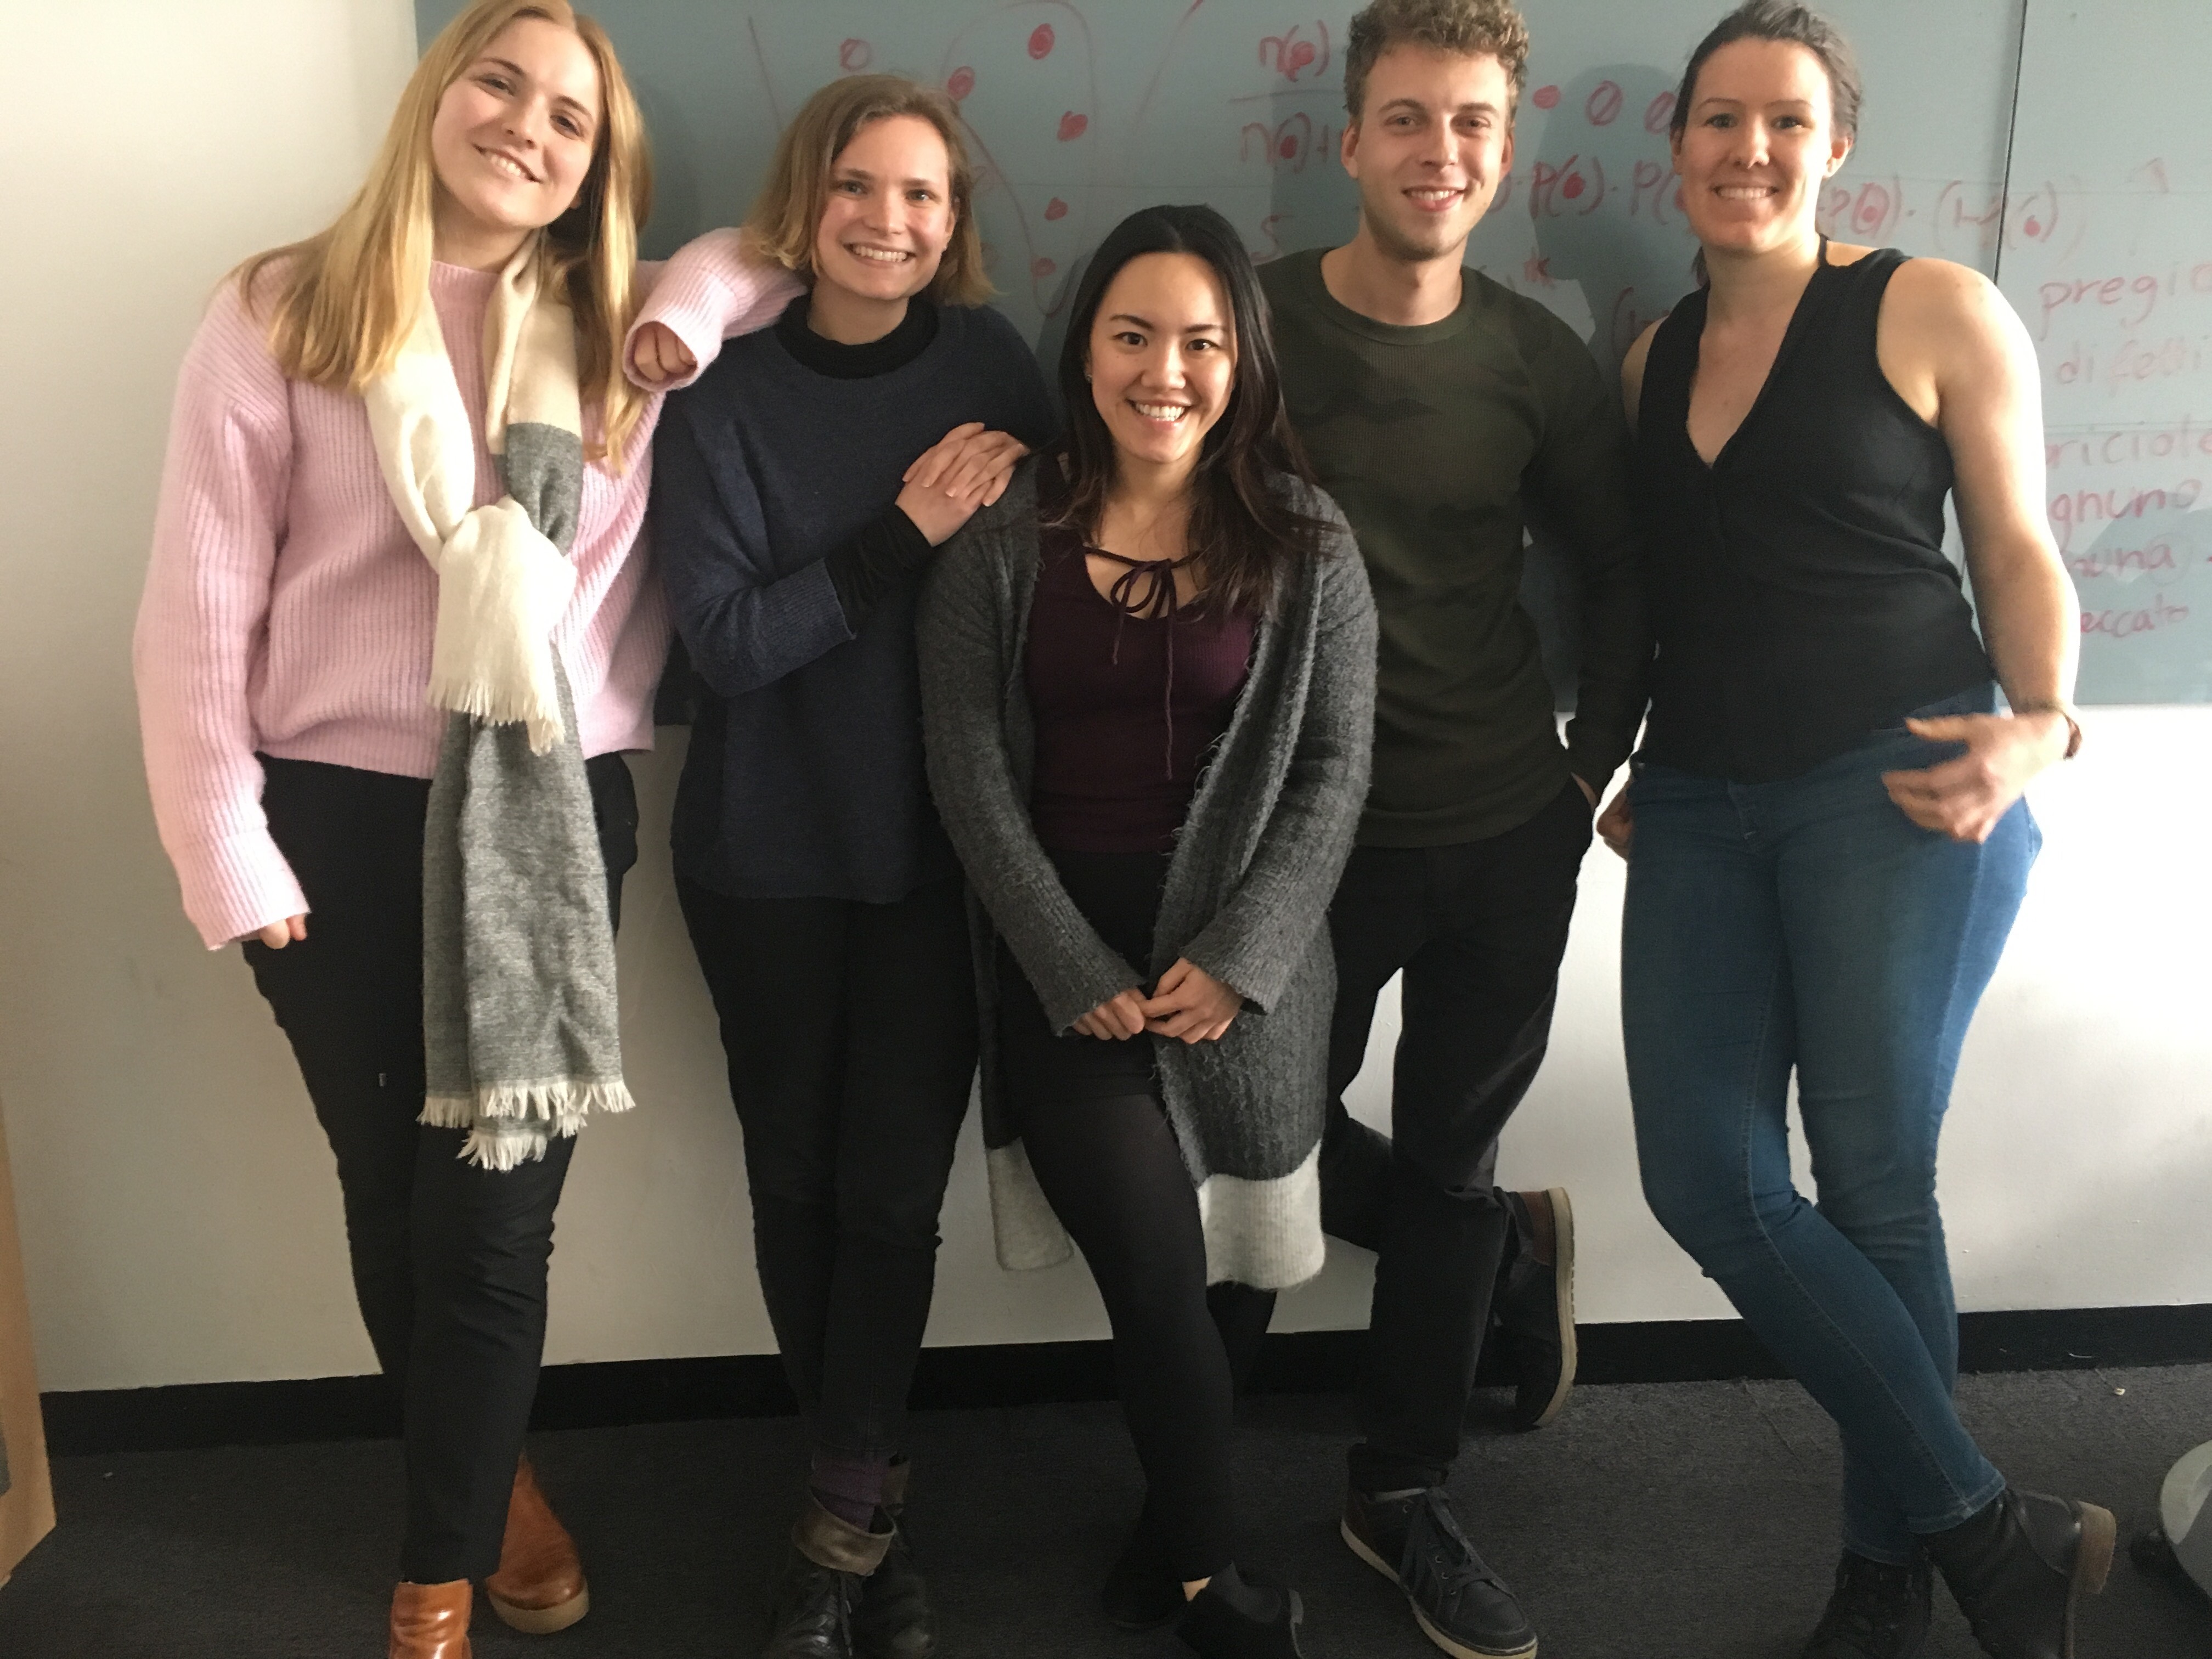
if(input$nodes == 64 && input$probfor == .64 && input$probback == .64){
output$FFplot <- renderImage({
return(list(
src = "www/group.jpg",
contentType = "image/jpg",
alt = "The developers being weird"
))
},deleteFile = FALSE)
} else {
output$FFplot <- renderPlot({qgraph::qgraph(g4, color = clusters4, edge.color = "darkgrey", edge.width = .5, vsize = 5,
border.color = "black", shape = "circle", label.cex = 1.5, label.color = "white",
bg = "gray94", borders = FALSE)},
width = 950,
height = 700
)
}
})
})
## Initialize Geometric Random ----
g5 <- sample_grg(nodes = 100, radius = 0.2, torus = FALSE)
p5 <- try({clusters5 <- spinglass.community(g5)$membership})
if (class(p5) == "try-error"){
clusters5 <- "black"
}
g5 <- igraph::get.adjacency(g5)
output$RGGplot <- renderPlot({qgraph::qgraph(g5, color = clusters5, edge.color = "darkgrey", edge.width = .5, vsize = 5,
border.color = "black", shape = "circle", label.cex = 1.5, label.color = "white", layout = "spring",
bg = "gray94", borders = FALSE)},
width = 950,
height = 700
)
## Resample when button is pressed ##
observeEvent(input$sample5,
{
withProgress(message = 'Generating graph', value = 0, {
g5 <- sample_grg(nodes = input$node, radius = input$radius, torus = input$torus)
incProgress(1/3)
p5 <- try({clusters5 <- spinglass.community(g5)$membership})
if (class(p5) == "try-error"){
clusters5 <- "black"
}
incProgress(1/3)
g5 <- igraph::get.adjacency(g5)
incProgress(1/3)
output$RGGplot <- renderPlot({qgraph::qgraph(g5, color = clusters5, edge.color = "darkgrey", edge.width = .5, vsize = 5,
border.color = "black", shape = "circle", label.cex = 1.5, label.color = "white", layout = "spring",
bg = "gray94", borders = FALSE)},
width = 950,
height = 700
)
})
})
## Initialize Growing Random ----
g6 <- sample_growing(n = 100, m = 1, citation=FALSE, directed = FALSE)
p6 <- try({clusters6 <- spinglass.community(g6)$membership})
if(class(p6) == "try-error"){
clusters6 <- "black"
}
g6 <- igraph::get.adjacency(g6)
diag(g6) <- 0
output$SGplot <- renderPlot({qgraph::qgraph(g6, color = clusters6, edge.color = "darkgrey", edge.width = .5, vsize = 5,
border.color = "black", shape = "circle", label.cex = 1.5, label.color = "white", layout = "spring",
bg = "gray94", borders = FALSE)},
width = 950,
height = 700
)
## Resample when button is pressed ##
observeEvent(input$sample6,
{
withProgress(message = 'Generating graph', value = 0, {
g6 <- sample_growing(n = input$vertices, m = input$edges, citation=input$citation, directed = input$directed6)
incProgress(1/2)
g6 <- igraph::get.adjacency(g6)
diag(g6) <- 0
incProgress(1/2)
output$SGplot <- renderPlot({qgraph::qgraph(g6, color = "black", edge.color = "darkgrey", edge.width = .5, vsize = 5,
border.color = "black", shape = "circle", label.cex = 1.5, label.color = "white", layout = "spring",
bg = "gray94", borders = FALSE)},
width = 950,
height = 700
)
})
})
# Upload file ----
observeEvent(input$upl, {
withProgress(message = 'Generating graph', value = 0, {
incProgress(1/4)
file <- input$data
if (is.null(file)) {
# No file has been uploaded
return(NULL)
}
datafile <- read.table(file$datapath, header = TRUE)
datafile <- as.matrix(datafile)
diag(datafile) <- 0
usergraph <- igraph::graph_from_adjacency_matrix(datafile)
t <- try({userclusters <- igraph::spinglass.community(usergraph)$membership})
if(class(t) == "try-error"){
userclusters <- NULL
}
incProgress(1/4)
tab <- data.frame("Model" = c("Barabasi-Albert",
"Erdos-Renyi",
"Geometric Random",
"Growing Random"),
"LogLikelihood" = rep(NA,4))
# Extract degree distribution
graphobject <- igraph::graph_from_adjacency_matrix(datafile)
degree <- igraph::degree(graphobject, mode = "in")
output$graph <- renderPlot({qgraph::qgraph(datafile, labels = TRUE, directed = FALSE,
bg = "gray94", color = userclusters, layout = "spring")})
incProgress(1/4)
# Compute the loglikelihoods
barabasi.albert.logl <- sum(log(degree^-3))
erdos.renyi.logl <- sum(log(dbinom(degree, (length(degree)-1), mean(datafile))))
geometric.logl <- sum(log(dgeom(degree, mean(datafile))))
growing.logl <- sum(log(growing(degree)))
# Fill the table
tab[1,2] <- barabasi.albert.logl
tab[2,2] <- erdos.renyi.logl
tab[3,2] <- geometric.logl
tab[4,2] <- growing.logl
tab[which(tab[,2] == Inf | tab[,2] == -Inf), 2] <- -Inf
# Order according to higher likelihood
tab <- tab[order(-tab$LogLikelihood),]
tab[which(tab[,2] == -Inf), 2] <- "Not computable"
output$result <- renderTable(tab)
})
})
# quizResponses ----
correctResp <- c("Correct! Well done!", "Super!", "Great job!", "Your answer is right!", "You're amazing")
wrongResp <- c("Not quite right, try again!", "Not quite, maybe try another answer!",
"That is not the right answer.", "You might want to rethink your answer.")
observeEvent(input$submit1, {
if (input$graph_id == "erdos") {
showNotification(sample(wrongResp, 1), type = "warning")
} else if (input$graph_id == "barab") {
showNotification(sample(wrongResp, 1), type = "warning")
} else if (input$graph_id == "forest") {
showNotification(sample(wrongResp, 1), type = "warning")
} else {
showNotification(sample(correctResp, 1), type = "message")
}
})
observeEvent(input$submit2, {
if (input$usage == "1" | input$usage == "3") {
showNotification(sample(wrongResp, 1), type = "warning")
} else {
showNotification(sample(correctResp, 1), type = "message")
}
})
observeEvent(input$submit3a, {
showNotification("Good answer - actually, all response options are correct here.", type = "message")
})
observeEvent(input$submit3b, {
if (input$barabasi2 == "2" | input$barabasi2 == "3" | input$barabasi2 == "4") {
showNotification(sample(wrongResp, 1), type = "warning")
} else {
showNotification(sample(correctResp, 1), type = "message")
}
})
observeEvent(input$submit4, {
if (input$geom == "1") {
showNotification(sample(correctResp, 1), type = "message")
} else
showNotification(sample(wrongResp, 1), type = "warning")
})
observeEvent(input$submit5, {
if (input$fire== "forest") {
showNotification(sample(correctResp, 1), type = "message")
} else
showNotification(sample(wrongResp, 1), type = "warning")
})
observeEvent(input$submit6, {
if (input$final == "10") {
showNotification("You're absolutely right! Well done!", type = "message")
} else {
showNotification(sample(wrongResp, 1), type = "warning")
}
})
}
# Run----
shinyApp(ui, server)